The home-work mobility survey of the BIZ of Asti was carried out in two phases with a total duration of 4 months. The survey was concluded on 20 December 2011.
The sample
In total there were 271 questionnaires collected that correspond to employees from 28 different companies. This sample represents 10% of the employees and 10% of the companies present at the BIZ.
The full survey analysis can be downloaded here: Mobility Survey Asti. However, some of the results are presented below.
Town of residence
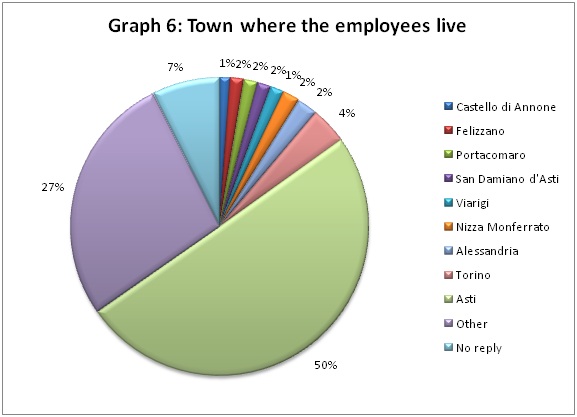
The town of residence for the majority of the interviewed employees is Asti (50%) followed by Torino (4%). However, the survey has showed a great dispersal of the employees in the villages and towns surrounding Asti as the remaining 39% of the interviewed employees lives in 69 different locations. In particular, there are 50 villages and towns where just 1 employee lives and 12 additional ones where just 2 employees live, these are grouped under “Other” in Graph 6.
Home-work trip
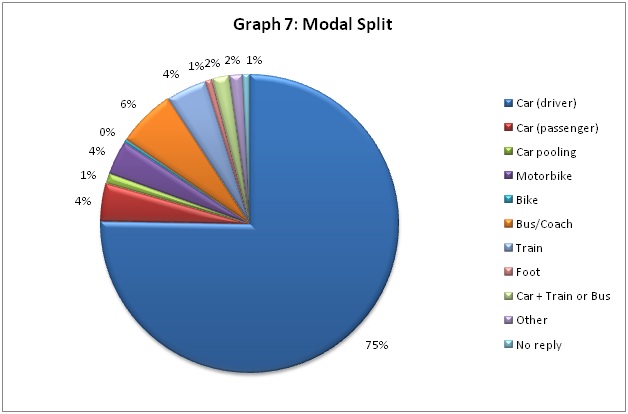
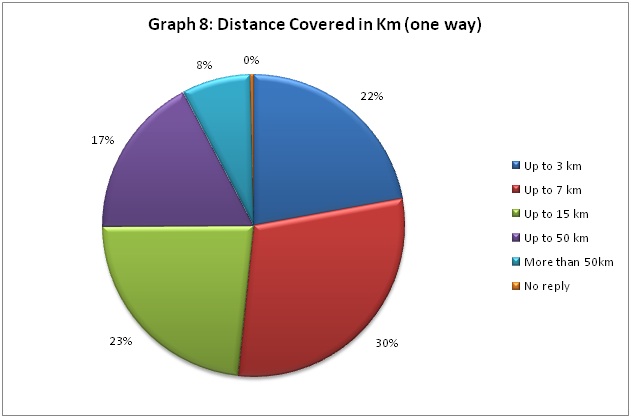
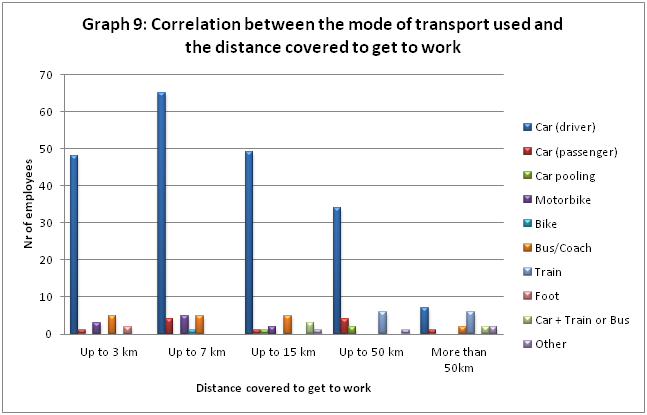
As it was expected the majority of the employees interviewed (75%) in the BIZ of Asti travel to work by car and only a small part (11%) uses sustainable modes of transport such as public transport, cycling or walking (graph 7). This is despite the fact that the majority of the sample (75%) covers a distance less than 15km to get to work, and 52% lives within a 7km radius from the BIZ (graph 8).
As the analysis has showed even when the distance covered is relatively small, up to 3km, and could easily be covered by bike or even on foot, the car is still the most popular mode of transport for the home-work trips (graph 9).
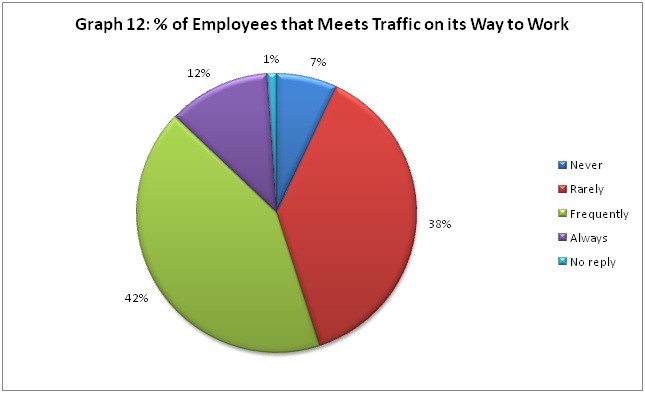
As regards the presence of traffic, the majority of the interviewed employees (42%) declared that they frequently meet road traffic during their home-work trips and an additional 12% has declared that they always meet traffic (graph 12).
Public transport evaluation
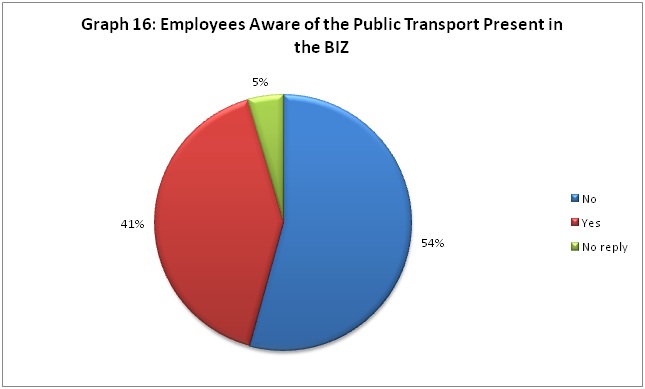
An interesting finding of the survey is that the majority of the sample (54%) is not aware of the public transport that serves the industrial area and in particular zone Z1 (graph 16).
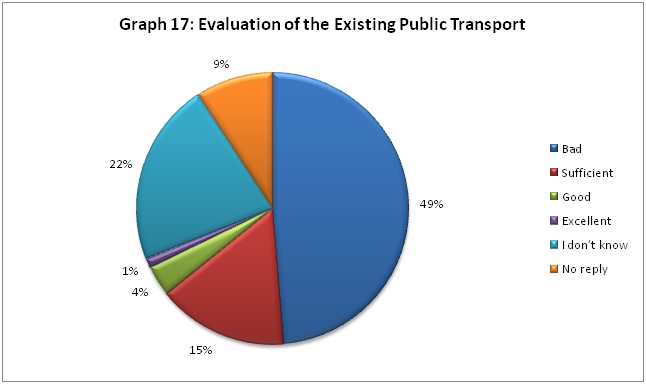
In addition, the majority of the interviewees (46%) has evaluated the existing services as bad, a 15% as sufficient and only a 5% as good or excellent (graph 17).
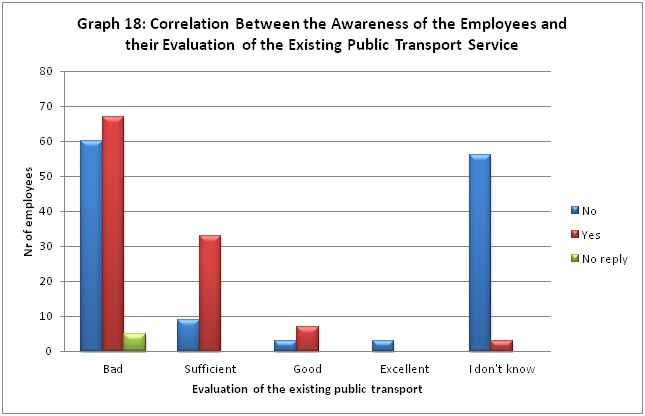
A correlation between the awareness of the public transport service and its evaluation, has shown that the majority of the employees that does not know the existing bus line that serves zone Z1 has evaluated it as bad (graph 18).
The existing service has also been evaluated as bad by the majority of the employees that are aware of it.
This is an indicator of two facts regarding the existing public transport service:
- it has a bad image among the public;
- it does not meet the needs of the employees of the BIZ.
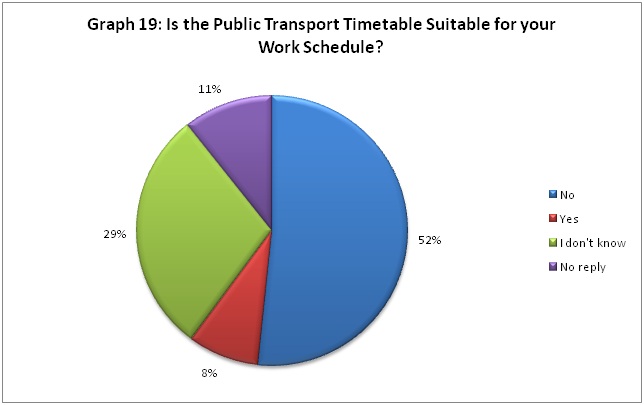
In fact only 8% of the employees has declared that the existing public transport timetable meets the needs of their work schedule whereas 52% have declared that it does not (graph 19). Another interesting finding is that 29% of the employees do not know if the existing bus line is suitable for them or not.
Therefore, there appear to be two main fields of improvement of the public transport service:
- timetable and frequency;
- awareness and communication.
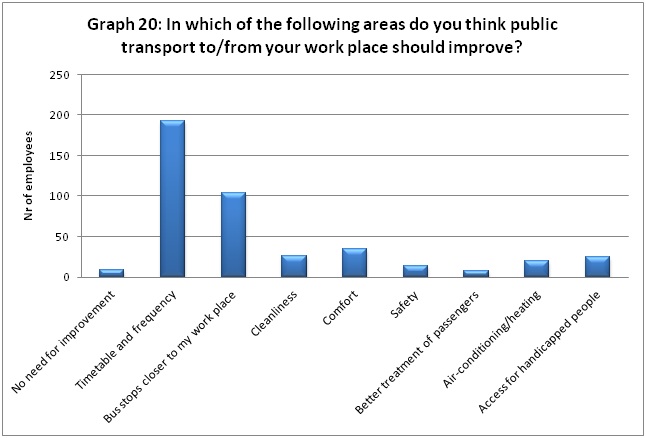
When the local employees were asked in which areas they thought that the existing public transport should be improved the majority of them indicated the timetable and frequency of the buses, which is in accordance with the previous analysis. Another big part of the sample indicated the bus stops should be closer to the place work (see graph 20).
Mobility behaviour analysis
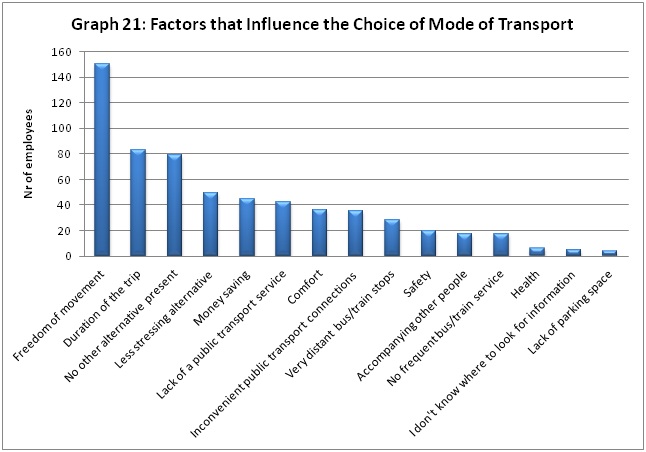
The mobility behaviour of a person is largely influenced by time and cost. When the employees of the BIZ of Asti where asked to point out the factors that affect their choice of the mode of transport for their home-work trips the factor time (duration of the trip) was the second most indicated whereas the factor cost (money saving) was fifth (graph 21). The main factor influencing the majority of the employees appears to be the freedom of movement. The lack of other alternatives is also an important factor.